A graph gold model for the IMDB dataset
KuzuDB to the rescue
Introduction
In a previous article we investigated the IMDB non-commercial dataset through DBT and its DuckDB connector. This investigation lead to a beautiful learning path of lateral joins in DuckDB. In that article we investigated how the medallion architecture could be used to analyse this dataset and how helpful it was in order to distinguish the various layers. While not strictly adhering to that principles, we introduced an intermediate casting layer and a final cleansing layer, called silver. We were able to cope with the numerous pathologies of that dataset and finally arrived at a curated set of tables in DuckDB that satisfy the closed world principle (no dangling references). It was a cumbersome undertaking and due to the huge nature of the full dataset we had to cut corners and not introduce a formal Airflow pipeline. An initial approach did not work out because of the huge RAM requirements of the Dockerized solution. Not all is lost (forthcoming article). However a piece of the medallion architecture was missing. A crucial one. The Gold Layer. We aim to rectify this situation in the present article.
Gold layer as a graph model.
Typically, just before the Gold Layer, lies as set of of curated tables, the Silver layer, that removes pathologies at the table level. We will not go into details since a lot are covered in the first article. But the Gold Layer is a different beast. Here the knowledge encoded in the individual tables is fused to ontologies that span many of them. The aim of this layer is to provide a foundation for creating reports by running analytic queries on its related tables. It is the place where business intelligence can look for information so as to enable observability of the business operations, strategies and campaigns among others. Typically the Gold Layer is a set of views (materialized or not) that stitches information that is scattered across tables into a whole. That way business has the opportunity to get a global view of its operations and get helpful insights that can lead better strategic decisions. SQL queries are used to define these views, and SQL queries or Data Frames are used to create the reports. There can be various ways of stitching this information as explained in the very insightful and highly recommended post. The approach is not unique but it pertains to business. However with the insightful work of Neo4J folks, the last decade a pattern started arising. If the data have a natural inherent graph structure why not go directly to a graph model as the Gold Layer. After all, with the recent SQL/PGQ standard we are not confined to the classical good old relational SQL. We just got yet another weapon in our arsenal with tackling business complex landscape. It is another way to query our data if it has a Property Graph structure. This is a huge benefit because we do not have to think about what model to select. Like in the Lake House architecture where our tables are hidden in files, now our model is hidden in nodes and links. A Graph Database can uncover this information and Graph Data Science is here to provide an unprecedented set of analytics.
Deciding on the Graph Database.
Table models in DBT are the bread and butter of this precious modelling tool. Given its ELT nature we can transform models to models until we can arrive through cleansing to something of value to business. The IMDB dataset is no exception. Since there is an inherent graph data structure in this dataset a Graph Model is a go to model for the Gold Layer. By creating this Gold Model, we can query it in place or export it in a Graph Database. At the time of this writing the DuckDB/PGQ extension is still a research prototype without a Windows binary. My machine is a Windows x64 10 PRO and I cannot use it even in this alpha version. Therefore, querying in place is a no go for Windows users at least. I am definitely in need of another Graph Database where I can migrate my model for graph querying. Neo4J comes to mind first but it is slow and because of my Dockerized setup I encountered failures when moving huge amounts of data. In the unsupported folder of the code base you can find the necessary code. If you are lucky or skillful enough, please provide me with your approach in the comments and I will incorporate it. I settled with KuzuDB because like DuckDB runs as a native app on Windows and does not require Docker. Also it is an embeddable one with the ability to write to disk. So its installation and use is a breeze through the Python client. Getting it installed is as simple as a
pip install kuzuIt still has a Dockerized client if you need a REPL. Fortunately the same model we will create, works both in Neo4J and KuzuDB and you can export from DuckDB to both with a proper notebook and scripts.
Stitching the IMDB gold layer through DBT.
Kùzu implements a structured property graph model and requires a pre-defined schema. Also at the time of this writing, it does not support composite keys. So every node must have a primary key that is a field of the node and edges link nodes though these primary keys. Neo4J use these primary keys to create indexes and KuzuDB does something similar. The approach amounts to:
# Create schema
conn.execute("CREATE NODE TABLE User(name STRING, age INT64, PRIMARY KEY (name))")
conn.execute("CREATE NODE TABLE City(name STRING, population INT64, PRIMARY KEY (name))")
conn.execute("CREATE REL TABLE Follows(FROM User TO User, since INT64)")
conn.execute("CREATE REL TABLE LivesIn(FROM User TO City)")
Nothing extraordinary. But we need a way to identify nodes through primary keys and define edges appropriately. This can happen inside DBT, since the edges and nodes can be individual tables. We can definitely use DBT to create them as table models and even unit test our approach. DuckDB has no problem to host huge datasets and DBT can be used to pump the data. This shows the real power of DBT. We create our Gold Model as a views to silver layer tables through DBT, strictly by the book. This is a big deal if you take a moment to ponder over it.
Constructing the edges and nodes
The main question still remains. What are the nodes and what are the edges in our case. In the relational realm, the edges come from referential integrity. Typically a Relational database can be transformed easily to a graph through referential integrity by making tables to nodes and relations to edges. The flexible nature of DBT which does not mandate a simple relational structure in our data allows for even more possibilities.
Definitely seeds and existing tables are nodes. However, some of our tables have composite primary keys. Nodes need a primary key and KuzuDB does not offer composite keys. We resort to the simple approach, since our composite keys have at most two members, to cast them to strings and join with the underscore like below.
select (cast key_1 as string) || '_' || (cast _key_2 as string) as idBy luck we do not have clashes. In other cases where clashes ensue, we need a different approach. Edges pose a more complex challenge. As an example, while region and language are simple references (tile_akas has entries that each has a region and a language), other entries have arrays with seed elements. These arrays hint towards a vectorized relation.
While this sounds simple, there are cases where we do not have seeds. Seeds are implicit like the types field in the title_akas models. We can transform these vectorized relations to simple ones by un-nesting the arrays and creating artificial nodes for their elements by taking their set (with select distinct). For the types field mentioned above this is not required since we have an explicit set of distribution types (seed distribution_type) but for the attributes field this approach works. In this respect, array fields can be transformed to multiple edges towards nodes that are explicit (existing seed or table) or implicit (artificial). It is not necessary to create artificial nodes for each array field. Our guide here is the cardinality. Small cardinality is an indication that we can apply the approach. High cardinality is the opposite. For the IDMB dataset we are lucky enough to not have the second case. When an array field becomes an edge, then it disappears from the node corresponding to this table. The rest of the attributes remain though.
Examples
An example artificial node follows. Here is the from node
Next is the to node
and then the edge
In other cases we do not need artificial nodes. Here is a from node
Next is the to node
and then the edge
Feel free to read in the code base and understand the way principles are applied. Now that we have our Gold Model as a set of tables describing links and nodes, we need to import them to a real database.
Importing our DBT model to KuzuDB
Fortunately DuckDB is a swiss army knife of Data Engineering file formats and KuzuDB can import Parquet files. Neo4J can use compressed CSV files. By selecting the Parquet format, we strike two birds with one stone. The Parquet files can be uploaded to an S3 bucket, possibly in smaller Parquet chunks in order to allow for GraphX queries through Apache Spark if we need to. We have KuzuDB at our disposal, but keep it as an additional bonus. The lists of steps necessary to create our graph amounts to
- Export the gold model from DuckDB to Parquet
- Create KuzuDB schemas for links and nodes as sql files
- Import the schemas to KuzuDB
- Create KuzuDB import files for each parquet to the corresponding edge or node (something like COPY CSV in SQL)
- Execute the import statements in KuzuDB
The creation of the schemas and import files is a bit of a chore but it pays off to learn more about KuzuDB. The export from DuckDB and import to KuzuDB can happen through the corresponding Python clients. For this one we have two notebooks. Feel free to read them. This is not where the real magic happens though. It happens in the dml_statements folder. Here is an example for schema and import of the title_akas_node
and here is the schema andimport of the has_attribute link
The export/import for my corporate security locked down laptop took long and has to do with my setup. If other user has a Windows machine, please share results in the comments. This is not representative of the performance. HUGE UPDATE!!!: The KuzuDB team kindly took the time to ran a number of tests. For them the whole process was at least 10x faster on their MacBooks than the number I shared with them. In this respect KuzuDB is king in terms of convenience and performance. Possibly my Neo4J woes has to do with the bad laptop. Still the performance as reported is not on par with MacOS and Linux. They are hard at work to close the gap. Till then use it under these OSes.
Having done that we can connect the Dockerized client of Kuzudb to view our schema or run queries. Startup your docker and to connect, run
docker run -p 8000:8000 -v C:/work/imdb_graphdb_article/kuzudb_version/kuzudb_elt:/database --rm kuzudb/explorer:latestVoila!

Concluding remarks
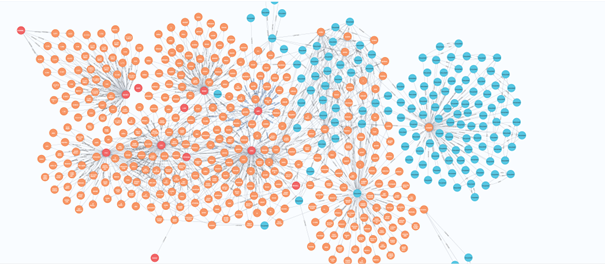
Here we showed how you can use a Graph Model as a Gold Model for the Medallion architecture. The analytics do not have to run to the same database but DBT can help considerably to prepare the Gold Model for export and easy import by using its super powers. We also displayed the usefulness of the KuzuDB as a way to avoid Docker and Neo4J as an embeddable graph store that can handle without problems (as opposed to Neo4J) a really huge dataset. As usual the code is provided and can run locally. Feel free to download, run it and report back problems (if you find one) in the comments section. With Graph Databases, Data Engineering entered into a new exciting era. It now provides a substrate for Graph Analytics and Graph Data Science which can offer deeper insights as opposed to traditional approaches. I hope you enjoyed the article which was not an easy undertaking to be honest.
Update: Mention the generous and friendly approach of the KuzuDB team that run the benchmark for the loading and correct any mis-interpretation of my post.
Update: A comprehensive gold business is located here. Instructions outlined above still apply.