Beginning open telemetry manual instrumentation
A pedagogical introduction for Pythonistas
Background
One of the current hot topics in software engineering is observability. Observability is different from resource monitoring for performance reasons. Especially with the massive move to cloud services, developers are continuously optimizing performance since it negatively impacts the budget of keeping the deployed applications operational. However, this is not enough in itself. Observability is here to verify the performance gains or even find places where services are working in a suboptimal way at conceptual level. Monitoring can also help debug errors in the context of microservices by distributed tracing the requests and correlating them to find the misbehaving service. Adding observability to your platform is so common and indispensable these days, that when you do microservices, sooner or later you will need to add it to your application either on or off premise and reach a reliability engineer to support you. This is such a well researched topic that you can find lots and lots of reference on the internet. In my case, I was interested in distributed tracing for my microservice (a feature in our backlog) and eventually had to do my research.
Opentelemetry and Openzipkin
While the initial naive approach was to implement something like that, a colleague informed me that there is a package they use in their Typescript service, but also there are tools installed that can plot the traces. People in my workplace had set up Zipkin and my application was in Python with Flask. So the immediate reaction is that something should exist in pip (since the others had something in Typescript). A spike followed, and the colleague who did the spike recommended Opentelemetry since it is a very popular option. As a wizard's apprentice I decided to research the Medium for alternatives since I did not like only one option and voilà! I run across this fantastic article about py_zipkin. Problem solved! Or not? The solution fiddled with custom headers exclusively for Zipkin.
Then I took a closer look at Opentelemetry. Opentelemetry attempts to solve the same problem in a standardized way. Additionally, it can save the distributed traces not only to Zipkin but also Jaeger among others. But the SDK that comes with it, isolates you from the implementation details (the headers) and has versions for many other programming languages. This is why people use it, and this was something I should add to my application. I had no experience. So I decided to rewrite the py_zipkin GitHub example of the article in python 3.10 and opentelemetry. I went with manual (vs automatic) instrumentation in order to learn as much as possible from the SDK. The next subsections describe this exciting journey.
First Prototype
I followed closely the initial approach. The plan is to have a docker image per service. All services communicate through the next DAG (Directed Acyclic Graph) by doing a get to an endpoint. At the end they talk to service 3 which just “sleeps” for 2 seconds and then returns. All of them display their traces to Zipkin

Nothing fancy, but it captures the essence of the problem. Initially, I tried to make a port by using the documentation. So the first prototype emerged, similar in nature to the original app. You can find it in my repository as branch prototype-1.
What is worth mentioning is that I had to research a bit in order to find a way to name the spans of the services. This Stackoverflow post helped me. The relevant snippet in the source code is this for app1
Let's fire the app with
docker compose build
docker compose up
navigate with your browser to
to trigger the message exchange. It finishes with an OK message. Then, we navigate to our dockerized Openzipkin.
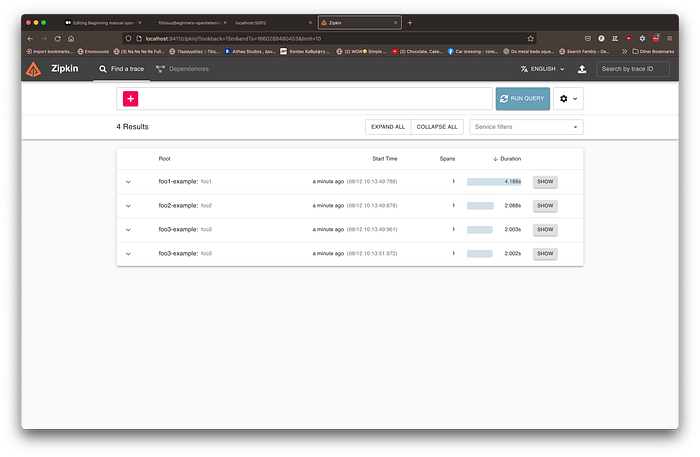
Ouch! It does not look like the beautiful nested tracing of the first prototype. Spans see to be unrelated between them. What went wrong?
Enter the context (second prototype)
It turns out that the first prototype does not propagate contextual information to “link” the spans. So app1 has no way to say to app2 “Hey, this request originated within a context”. Also, app2 has no way to say to app3 “Hey, this request originated within the context I had been handed over”. Back to Opentelemetry documentation for manual instrumentation. There is no example for context propagation. Stack overflow or snippets in google searches did not help me. So I had to delve into the source code. There is sample code that is not working as a comment section. So after trial and error, I “converged” to a solution. In the rest of the paragraph, I break down the solution, keeping as much as possible from the hinted solution. The branch in my repository is named prototype-2.
The essence of the solution mimics the original one. Use headers to pass around the context. I log in the source code of the headers, so the interested reader can see what is going on. The comment is not correct and I had to further delve to the code. First, we need an object that has a set and get method that are actually the functions other comment. I implemented them in a quick and dirty way by abusing … a bit… the Python class system.
Now that I have this object, I can implement the pattern that is outlined in the comment.
Step 1: Create a propagator
Step 2: Grab the propagated context from upstream
The context is set to None, since we use the default one.
Step 3: Hand over the propagated context downstream
The context is set to None again, since we use the current context. We have two services, so we inject twice.
Let’s fire the app with
docker compose build
docker compose up
navigate with your browser to
to trigger the message exchange. It finishes with an OK message.
Now Openzipkin looks much, much better.
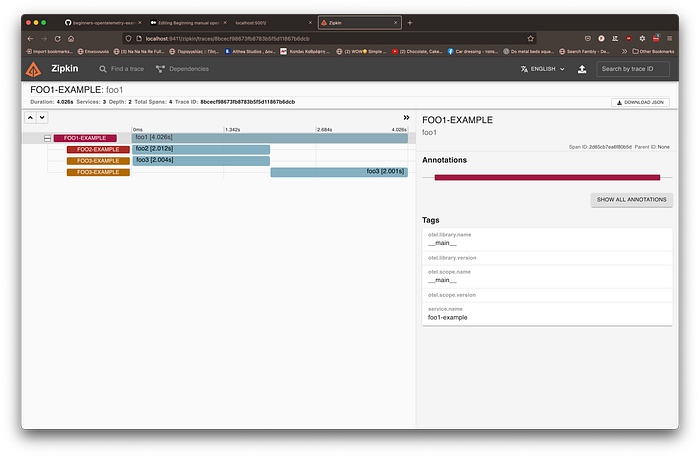
Mission accomplished. We were able to reproduce the original prototype. We can see that the last processing in app3 happened after the first one processing in app3 and since it is only nested in app1 it happened after app2 (which nests its own call to app3).
The careful reader will notice that if app2 and app3 were not called from app1 sequentially but in parallel, then, the app3 calls would have the same timeline without a clear time order. Very hard to understand which is the originator that called app3. Is the originator app1 or app2? It is a good idea to annotate (tag) the relevant span with the upstream service. But how?
Enter the baggage (the final application)
First things, first. As I explained below, I need to set an attribute, “upstream.service” on the span. This is the easy part. The documentation is crystal clear.
The careful reader will notice an extra change. I jumped from setting the context in the python “with” statement
to another form called “attaching context”
This is also covered in the documentation. I used it as a cleaner solution in my case.
I mistakenly thought that by setting some attributes in context, it will work out. After a couple of lost hours turning back to a general overview of the concepts behind opentelemetry, I realised that I was searching for Baggage. While context sets up a context, baggage allows exploiting the context to propagate parameter values. Again, the pattern of handing over was useful here too. But here I did not have to propagate anything since I had already setup context propagation. I only needed to retrieve the upstream service name and pass downstream the current service name. Details in the next snippet
It is worth mentioning that context is immutable, so setting a parameter on it produces a new context.
Let’s fire the app with
docker compose build
docker compose up
navigate with your browser to
to trigger the message exchange. It finishes with an OK message.
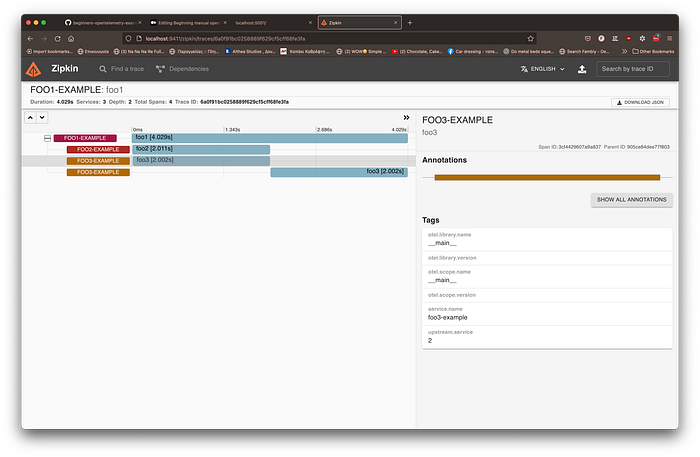
The Openzipkin now is super helpful because the tag is there :
Concluding remarks
We did not touch the concept of automatic instrumentation (for a Flask app in this case). The code is mostly for demoing concepts and all sources are credited. There have been some implementation in the company I work for, but I have not taken a look in it. This is production code and I wanted to document a self-learning path. Code was developed in Vscodium with Python 3.10.6 on a Mac. It is in this repository with the hope that others my find it helpful. Suggestions and corrections are welcome.